[ilink style=”tick”]Return to the blog post[/ilink]
To study how home improvement activity in San Francisco varies with rents and home values, we combined our own data on building permits in the city with information on rents and home values from Zillow. For each of 21 San Francisco zip code areas[1] we counted the number of homes each year associated with one or more home improvement permits.[2] We then merged the home improvement counts with each zip code’s average annual Zillow Rent Index (ZRI) and Zillow Home Value Index (ZHVI).
The relationship between home improvement activity and rents emerges from a series of regressions, shown in Table 1.
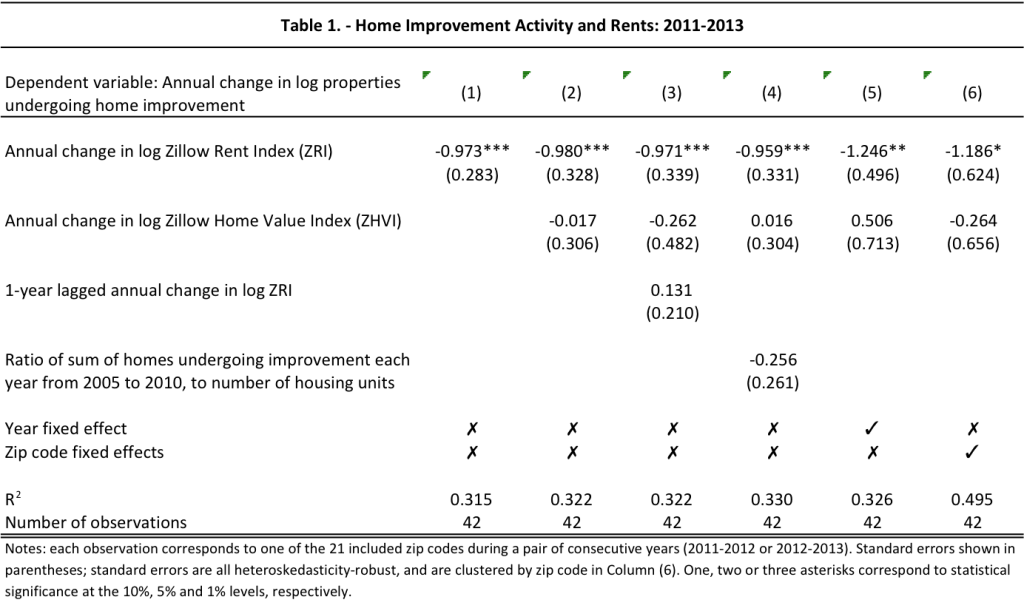
- Column (1) indicates the result reported in the main text, whereby “…from 2011 to 2013 an annual increase of 10% in rents in a zip code area was accompanied, on average, by an annual decrease of 9.7% in the number of homes undergoing improvement.”
- Column (2) conditions the estimate on contemporary changes in home values in the same zip code, and shows that the estimated effect associated with rents is not picking up the effect of correlated changes in home value.
- Column (3) addresses the possibility that home improvement activity is responding to changes in rent in the prior year, rather than the present one. This does not appear to be the case.
- Column (4) addresses the concern that in some zip codes, homes may have experienced both a greater increase in rents and less home improvement because they were in better condition prior to when we observe them. To capture the condition of homes in a zip code area, we summed the number of homes undergoing improvement in each year over the 5 preceding years, and took the ratio of this sum to the total number of homes in the zip code. When the homes in a zip code are in better condition, we expect that the variable we’ve constructed will be lower, reflecting a lower medium-run amount of renovation. The estimates in Column (4) indicate that the alternative explanation of the correlation between change sin home improvement and in rents does not appear to be responsible for the correlation.
- Columns (5) and (6) use indicator variables – “fixed effects” in econometric terminology – to control for the year of observation in Column (5) and the zip code in Column (6).[3] They show that the result that higher rents are accompanied by less home improvement emerges similarly, whether we compare different zip codes in the same year and report the average across years, or we look at the same zip code area from year to year, and report the average across zip codes.
Although each column does so with a different degree of precision, all of the columns in Table 1 indicate that a 10% increase in rents is accompanied by a roughly equal decrease in home improvement activity. All of the columns also indicate that changes in rent explain approximately a third of the variation in home improvement activity changes.
It is important to stress that all of the estimates presented herein do not indicate the existence of a causal relationship between rents and home improvement activity, although they do suggest it. In the main text we speculate with respect to the nature of possible causal effects.
The relationship between home improvement activity and home values also emerges from a series of regressions, which are shown in Table 2, below.
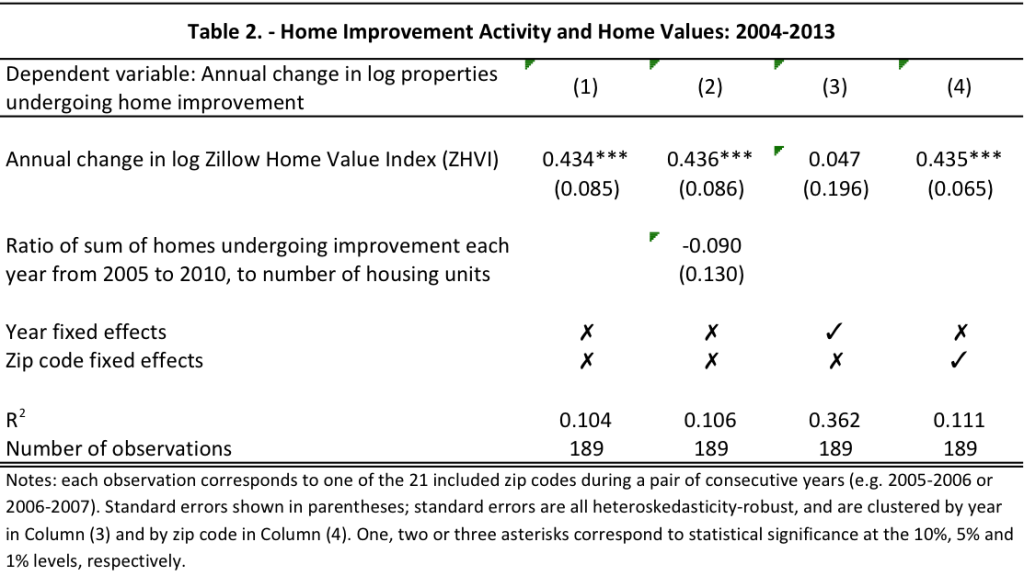
- Column (1) indicates the result reported in the main text, whereby “…From 2004 to 2013 we estimate that period, an annual increase of 10% in home values was associated with a 4.4% increase in the number of homes undergoing improvement.”[4]
- Column (2) conditions the estimate on the prior condition of homes, similar to Column (4) of the previous table. It shows that the current level of home improvement activity does appear to depend on the prior condition of homes.
- Columns (3) and (4) control for the year of observation and for zip code areas, respectively. The correlation between home improvement activity and home values persists when we consider zip codes in isolation over time (and report the average across zip codes), but it disappears when we consider all zip codes within a given year (and report the average across years). The implication is that the correlation is driven by changes over time within each zip code, but not by differences between zip codes.
We have conducted further analysis to investigate what the correlation between home improvement activity and home values is capturing, which will be the topic of a future blog post.
[1] We omitted zip code 94158, Mission Bay, because it overwhelmingly consists of new construction. Zillow home value and rent information is unavailable for zip codes 94104, 94129 and 94130 because they have very few residential properties, so we omitted them as well. The number of remaining San Francisco zip codes is 21.
[2] We associate building permits with home improvement in three steps. First, we run a Naïve Bayes classifier that associates building permits with new construction. Second, we further associate building permits with new construction if they were issued within up to one year of a new construction permit on the same property. Third, we associate all remaining permits with home improvement activity.
[3] Note that the fact that we are regressing changes in home improvement on changes in rents and home values already eliminates any fixed differences across zip codes. Including zip code fixed effects in a change-on-change regression eliminates and fixed differences across zip codes’ linear trends.
[4] Because the Zillow Rent Index does not span the entire period 2004-2013, we are unable to condition the estimate on changes in rents.
Leave a Reply